Squert
From http://www.squertproject.org/:
Squert is a web application that is used to query and view event data stored in a Sguil database (typically IDS alert data). Squert is a visual tool that attempts to provide additional context to events through the use of metadata, time series representations and weighted and logically grouped result sets. The hope is that these views will prompt questions that otherwise may not have been asked.
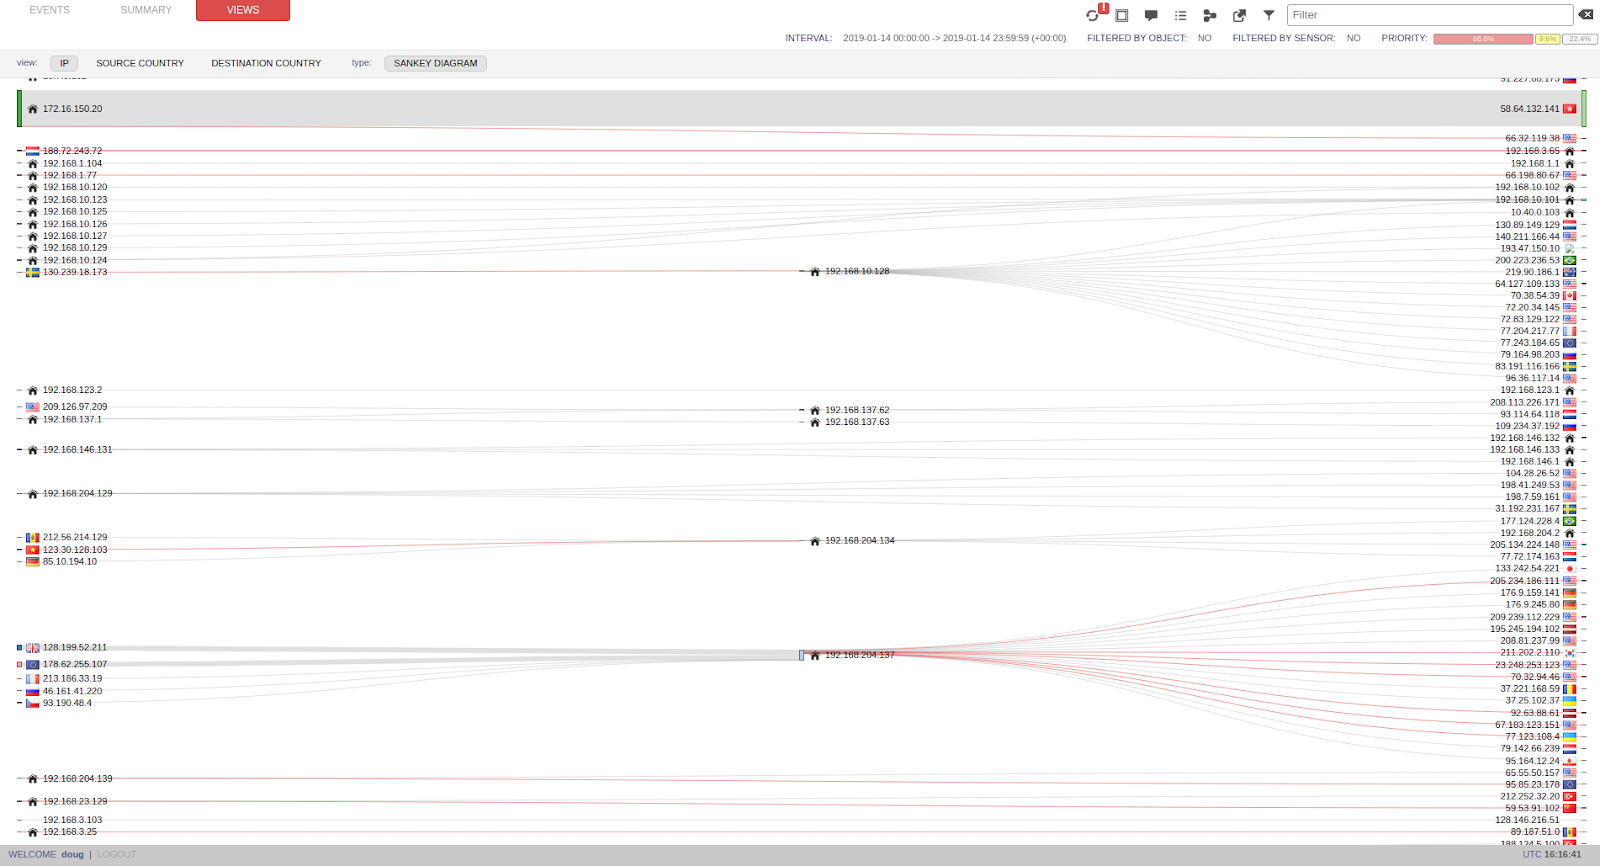
Screenshot
Authentication
If prompted for username and password, simply enter your normal Sguil/Squert/Kibana username and password.
Time Interval
The default view shows alerts from today. To show older alerts, click INTERVAL, then click the 2 right arrows, set your custom date, and click Squert’s refresh button (two circular arrows).
Time Zone
- click the time interval (labeled
INTERVAL) - on the right side, click the two arrows pointing right
- de-select
UTC - set your timezone offset (labeled
TZ OFFSET) - click the
save TZbutton
Timeplot
EVENTS page, represents events as they occur each day.- plots the raw number of events on a per minute basis.
- uses the X-axis as the hour of the day and the Y-axis is the number of events minute.
- treats each region equivalent to one hour.
- plots and underlines the number of events in each region for that hour.
Toggle Options
queue onlyon.This option refers to only showing events that are of a status of 0, or uncategorized and still residing in the active queue. If you would like to see all events, change it to off.
groupingon.This option refers to the grouping of the same type of event within a particular timeframe. If you would like to see the events as un-grouped, change this option to off.
Alerts
The alert pane consists of several columns, explained below:
QUEUE - refers to the number of grouped events in the queueSC - number of distinct source IPs for the given alertDC - number of distinct destination IPs for the given alertACTIVITY - number of events for a given alert on a per hour basisLAST EVENT - time event last occurredSIGNATURE - event IDS signatureID - event signature IDPROTO - protocol relative/recognized within/in regard to event% TOTAL - percentage of event grouping vs. entire event countPivoting to Full Packet Capture
Squert can pivot to CapMe for full packet capture. To do this, drill into an event and click on the Event ID.
Pivoting to Kibana
Squert can pivot to Kibana to query Zeek logs, Wazuh logs, syslog, etc. To do this, click an IP address, port, or signature, and then click Kibana.
Adding your own pivots
You can also add your own pivots as follows:
- In the upper right corner of Squert, click the Filters button.
- Set the type to URL.
- Click the + button.
- Click your New entry.
- Fill out the alias, name, notes, and URL fields as applicable.
- Click the Update button.
- Close the Filters and URLs window.
- To test, drill into an event and click an IP address. A context menu will appear and display your new link. Click the new link and verify that it opens a new browser tab going to the site you specified and passing the IP address that you clicked on.
Prepared Statements
Squert uses prepared statements. If you start seeing Prepared statement needs to be re-prepared in /var/log/apache2/error.log, please see the MySQLTuning#table-definition-cache section.