Kibana
From https://www.elastic.co/products/kibana :
Kibana lets you visualize your Elasticsearch data and navigate the Elastic Stack, so you can do anything from learning why you’re getting paged at 2:00 a.m. to understanding the impact rain might have on your quarterly numbers.
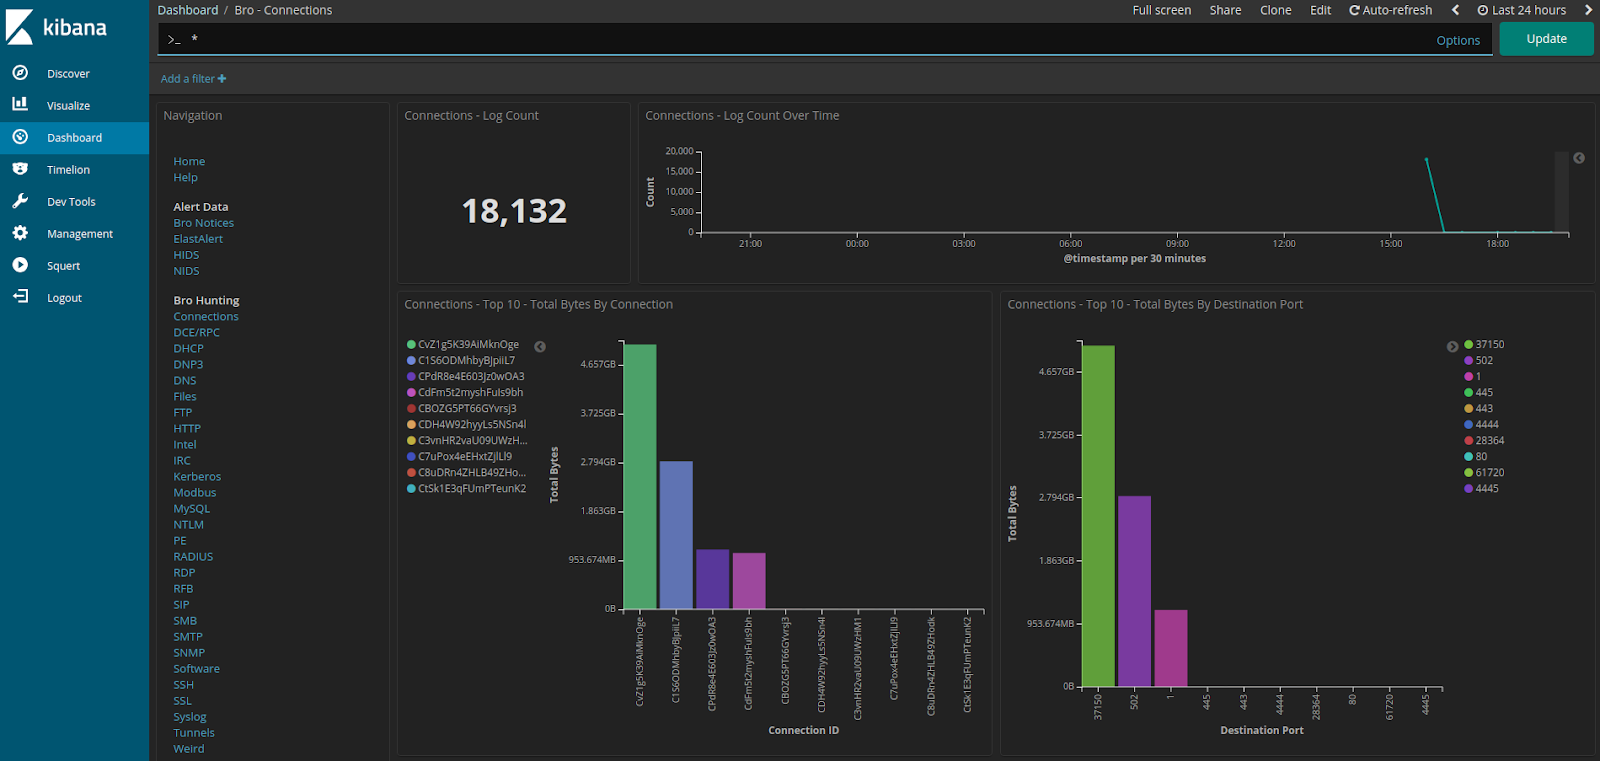
Screenshot
Authentication
If prompted for username and password, simply enter your normal Sguil/Squert/Kibana username and password.
Configuration
- Configuration files for Kibana can be found in
/etc/kibana/. - Other configuration options for Kibana can be found in
/etc/nsm/securityonion.conf. - Kibana logs can be found in
/var/log/kibana/.
Pivoting
Kibana uses multiple hyperlinked fields to accelerate investigations and decision-making:
Transcript
When present, clicking the _id field allows an analyst to pivot to transcript via CapMe.
Indicator Dashboard
When present, clicking these fields allows an analyst to pivot to the Indicator dashboard, where a variety of information is presented relative to the term:value.
uidsource_ipsource_portdestination_ipdestination_portSearch Results
Search results in the dashboards and through Discover are limited to the first 10 results for a particular query. If you don’t feel like this is adequate after narrowing your search, you can adjust the value for discover:sampleSize in Kibana by navigating to Management -> Advanced Settings and changing the value. It may be best to change this value incrementally to see how it affects performance.
Search Request Timeout
Sometimes searches can timeout in Kibana. To increase the timeout value to wait longer for results from Elasticsearch, we can adjust the value for elasticsearch.requestTimeout in /etc/kibana/kibana.yml and restart Kibana.
For example to increase the timeout from the default of 30 seconds to 90 seconds:
sudo vi /etc/kibana/kibana.yml
Add the following line:
elasticsearch.requestTimeout: 90000
Finally, restart Kibana:
sudo so-kibana-restart
Timestamps
By default, Kibana will display timestamps in the timezone of your local browser. If you would prefer timestamps in UTC, you can go to Management –> Advanced Settings and set dateFormat:tz to UTC.
Plugins
Please note that we do not officially support installing plugins. Do so at your own risk!
To add a plugin to Kibana, you can expose the plugins directory to the host filesystem and then copy your plugins to that directory. For example, to load the kbn_network plugin you can do something like the following.
Create a new directory in the host filesystem called /nsm/kibana/plugins to store plugins:
sudo mkdir -p /nsm/kibana/plugins
Download your desired plugin and decompress it to /nsm/kibana/plugins. For example:
wget -qO- https://github.com/dlumbrer/kbn_network/releases/download/6.5.X-1/network_vis-6-5.tar.gz | sudo tar zxv -C /nsm/kibana/plugins
Kibana now requires jquery.flot.log when re-optimizing, so let’s create that:
sudo touch /nsm/kibana/jquery.flot.log
Modify KIBANA_OPTIONS in /etc/nsm/securityonion.conf to mount /nsm/kibana/plugins directory and jquery.flot.log into the container:
sudo sed -i 's|^KIBANA_OPTIONS.*$|KIBANA_OPTIONS="--volume /nsm/kibana/plugins:/usr/share/kibana/plugins:ro --volume /nsm/kibana/jquery.flot.log:/usr/share/kibana/src/ui/public/flot-charts/jquery.flot.log"|g' /etc/nsm/securityonion.conf
Restart Kibana:
sudo so-kibana-restart
Monitor Kibana log file for errors:
tail -f /var/log/kibana/kibana.log
Kibana may take a few minutes to re-optimize. Once that’s complete, you should be able to log into Kibana and test your new plugin.