| Previous | Table of Contents | Next |
No Logical Access Control — Not having logical access control means that anyone can sign on the system, get to any information they wish, and do anything they wish with the information. Most tangible assets are not at risk. However, if IT staff productivity is regarded as an asset, as reflected by their annual budget, that asset could suffer a loss (of productivity) while the staff strives to reconstruct or replace damaged software or data. Also, if confidentiality is compromised by the disclosure of sensitive information (competitive strategies or client information), substantial competitive advantage and associated revenues could be lost, or liability suits for disclosure of private information could be very costly. Both could cause company goodwill to suffer a loss.
Since the only indicated vulnerability is not having logical access, it is reasonable to assume monetary loss resulting from damage to the integrity of the information or the temporary loss of availability of the information is limited to the time and resources needed to recover with well-secured, off-site backups.
Therefore, it is reasonable to conclude, all other safeguards being effectively in place, that the greatest exposure resulting from not having logical access control is the damage that may result from a loss of confidentiality for a single event. But, without logical access control, there could be many such events!
What if there was another vulnerability? What if the information was not being backed up effectively? What if there were no useable backups? The loss of availability — for a single event — could become overwhelmingly expensive, forcing the organization into bankruptcy or compromising a government mission.
No Contingency Plan — Not having an effective contingency plan means that the response to any natural or man-made disaster will be without prior planning or arrangements. Thus, the expense associated with the event is not assuredly contained to a previously established maximum acceptable loss. The event may very well bankrupt the organization or compromise a government mission. This is without considering the losses associated with the tangible assets! Studies have found that organizations hit by a disaster and not having a good contingency plan are likely (4 out of 5) to be out of business within 2 years.
What if there were no useable backups — another vulnerability? The consequences of the loss of information availability would almost certainly be made much worse, and recovery, if possible, would be much more costly. The probability of being forced into bankruptcy is much higher.
By mapping vulnerabilities to threats, and threats to assets, we can see the interplay among them and understand a fundamental concept of risk assessment: Vulnerabilities allow threats to occur with greater frequency or greater impact. Intuitively, it can be seen that the more vulnerabilities there are, the greater is the risk of loss.
Risk Metrics/Modeling
There are a number of ways to portray risk, some qualitative, some quantitative, and some more effective than others. In general, the objective of risk modeling is to convey to decision makers a credible, useable portrayal of the risks associated with the IT environment, (again) answering these questions:
- • What could happen (threat event)?
- • How bad would it be (impact)?
- • How often might it occur (frequency)?
- • How certain are the answers to the first three questions (uncertainty)?
- • How bad would it be (impact)?
With such risk modeling, decision makers are well on their way to making well-informed decisions either to accept, avoid, or transfer associated risk.
The following brief discussion of the two general categories of approach to these questions, qualitative and quantitative, will give the reader a degree of insight into the ramifications of using one or the other approach.
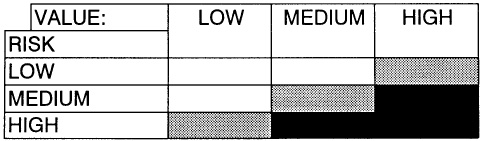
Qualitative — The definitive characteristic of the qualitative approach is the use of metrics that are subjective, such as ordinal ranking low, medium, high, etc. In other words, independently objective values such as objectively established monetary value, and recorded history of threat event occurrence (frequency) are not used.
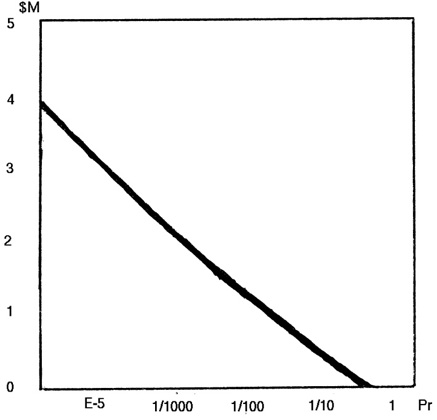
Quantitative — The definitive characteristic of quantitative approaches is the use of independently objective metrics and significant consideration given to minimizing the subjectivity that is inherent in any risk assessment. Graphics from a leading automated tool will illustrate quantitative risk modeling.
The graph shown in Exhibit 6 reflects the integrated “all threats” risk that is generated to illustrate the results of Risk Evaluation in BDSS™ before any risk mitigation. The combined value of the tangible and intangible assets at risk is represented on the “Y” axis, and the probability of financial loss is represented on the “X” axis. Thus, reading this graphic model, there is a 1/10 chance of losing about $0.5M over a 1-year period.
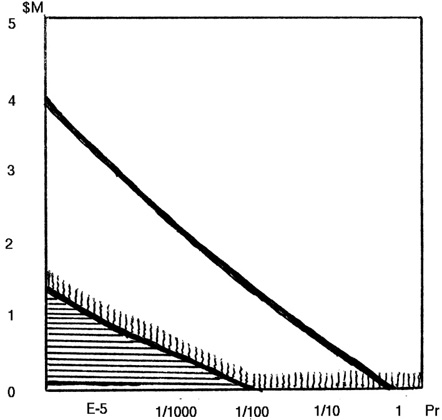
The graph shown in Exhibit 7 reflects the same environment after risk mitigation and associated cost/benefit analysis. The original risk curve (Exhibit 6) is shown with the reduced risk curve and associated average annual cost of all recommended safeguards superimposed on it so the viewer can see the risk before risk mitigation, the expected reduction in risk, and the cost to achieve it. In Exhibit 7, the risk at 1/10 and 1/100 chance of loss is now minimal, and the risk at 1/1000 chance of loss has been reduced from about $2.0M to about $0.3M. The suggested safeguards are thus shown to be well justified.
| Previous | Table of Contents | Next |