| Previous | Table of Contents | Next |
QUALITATIVE VS. QUANTITATIVE APPROACHES
Background
As characterized briefly above, there are two fundamentally different metric schemes applied to the measurement of risk elements, qualitative and quantitative. The earliest efforts to develop an information risk assessment methodology were reflected originally in the National Bureau of Standards (now the National Institute of Standards & Technology [NIST] FIPSPUB-31 Automated Data Processing Physical Security and Risk Management, published in 1974. That idea was subsequently articulated in detail with the publication of FIPSPUB-65 Guidelines for Automated Data Processing Risk Assessment, published in August of 1979. This methodology provided the underpinnings for OMB A-71, a federal requirement for conducting “quantitative risk assessment” in the federal government’s information processing environments.
Early efforts to conduct quantitative risk assessments ran into considerable difficulty. First, because no initiative was executed to establish and maintain an independently verifiable and reliable set of risk metrics and statistics, everyone came up with their own approach; second, the process, while simple in concept, was complex in execution; and third, large amounts of data were collected that required substantial and complex mapping, pairing, and calculation to build representative risk models; fourth, with no software and desktop computers just over the horizon, the work was done manually — a very tedious and time-consuming process. Results varied significantly.
As a consequence, while some developers launched and continued efforts to develop credible and efficient automated quantitative risk assessment tools, others developed more expedient qualitative approaches that did not require independently objective metrics, and OMB A-130, an update to OMB A-71, was released lifting the “quantitative” requirement for risk assessment in the federal government. These qualitative approaches enabled a much more subjective approach to the valuation of information assets and the scaling of risk. In Exhibit 1, for example, the value of the availability of information and the associated risk were described as “low,” “medium,” or “high” in the opinion of knowledgeable management, as gained through interview or questionnaires.
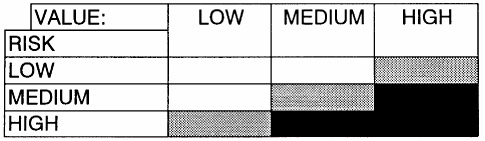
Often, when this approach is taken, a strategy is defined wherein the highest risk exposures (darkest shaded areas) require prompt attention, the moderate risk exposures (lightly shaded areas) require plans for corrective attention, and the lowest risk exposures (unshaded areas) can be accepted.
Elements of Risk Metrics
There are six primitive elements of risk modeling to which some form of metric can be applied:
- Asset Value
- Threat Frequency
- Threat Exposure Factor
- Safeguard Effectiveness
- Safeguard Cost
- Uncertainty
- Threat Frequency
To the extent that each of these elements is quantified in independently objective metrics such as monetary replacement value for Asset Value or Annualized Rate of Occurrence for Threat Frequency, the risk assessment is increasingly quantitative. If all six elements are quantified with independently objective metrics, the risk assessment is fully quantified, and the full range of statistical analyses is supported.
Exhibit 2 and the following discussion relate both the quantitative and qualitative metrics for these six elements:
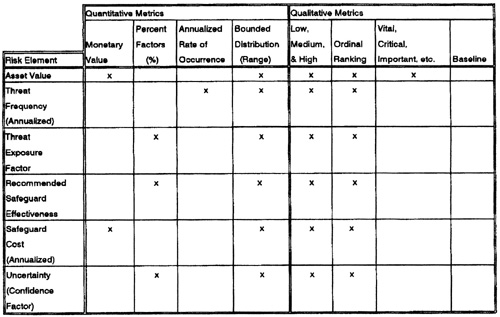
Quantitative Elements
Only the Asset Value and Safeguard Cost can be expressed as a monetary value. All other risk elements are effectively multipliers to (1) annualize, e.g., Annualized Rate of Occurrence (1/10 = once in ten years), (2) show an expected percentage of loss against asset value should a threat occur, e.g., $1.0M x 50% = $500K, (3) rate safeguard effectiveness in mitigating a vulnerability, e.g., 80% effective, or (4) rate uncertainty, e.g., I am 90% certain that these numbers are accurate.
The Bounded Distribution is a means of expressing all quantitative metrics not simply as a discrete value ($1.0M), but rather as a range that explicitly articulates uncertainty about the value, e.g., I am 80% certain that the customer file will cost between $175K and $195K to replace. Or, the USGS is 60% certain there will be an earthquake of 7.0 Richter or greater on the San Andreas fault in the next 20 years. The Bounded Distribution also has the advantage of making it easier to reach consensus on a value (such as the value of availability) where it is not otherwise readily available, as, for example, a “book value” from the general ledger might be.
| Previous | Table of Contents | Next |